We've lost product-market fit
April 30, 2025
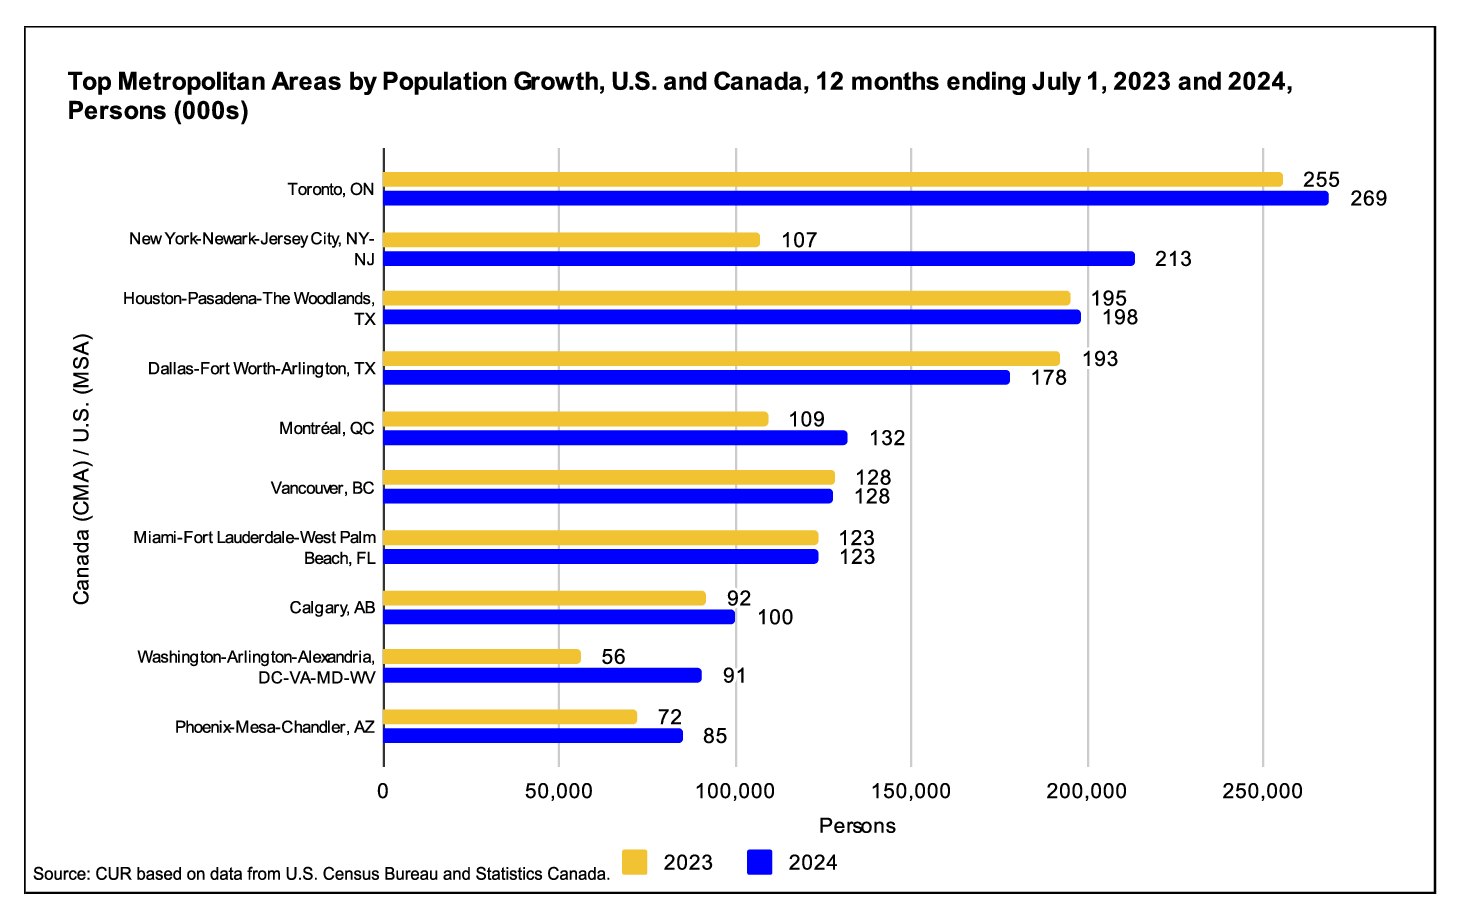
Vancouver is in the same boat as Toronto. The Globe and Mail recently reported that the number of newly completed, unsold condominium suites in the city is expected to increase to 3,493 by the end of this year, which would be a 60% increase compared to the end of last year and one of the highest levels of unsold inventory in recent times.
The profound change, as we know, is that individual investors have largely left the market. Also in the article is some commentary from Ryan Berlin, who is head economist of Rennie Intelligence. According to Rennie's data, investors made up about 50% of their buyers from 2020 to 2023. In 2024, this number dropped to around 25%. And so far this year, the number is ~7%.
At the same time, the math is not mathing for developers:
Real estate appraiser David Eger, vice-president of Western Canada for Altus Group Ltd., gave the example of an older Vancouver apartment block within the Broadway Plan that is currently on the market for $12.2-million. To achieve a profit margin of 10 per cent of total costs to redevelop the site, the developer would have to pay drastically less, around $3-million for the property. That's based on a rent of $5.50 per square foot, or $3,300 a month for a 600 square-foot unit.
In some ways, all of this is what housing critics wanted: "Too many speculative investors are buying new homes and outbidding actual end users." But now they're not. So where are all the end users? Aren't we in a housing crisis? This is the paradox of our current market. But I think the lesson is that a housing crisis does not necessarily equal a housing shortage in all segments of the market.
Another way to think about it is that the inventory that is now accumulating has lost product-market fit. The market used to be a lot of investors, but now it's not. So either the market needs to change again or the product needs to adapt to what the market wants today. And I suspect that, even in today's market, there would be strong demand for more affordable family-oriented housing.
The challenge is that our industry and our cost structures are not currently set up to deliver this kind of product. In software, it's relatively easy to pivot in search of product-market fit. But it's not so easy in real estate. Using the above example from appraiser David Eger, you'd need a negative land value (i.e. a subsidy) in order to be able to feasibly deliver more affordable family housing. That is, larger homes at a lower per square foot rent.
But I think this is how all city builders should be thinking right now. We should be viewing this point in the cycle as an opportunity. It's an opportunity to ask ourselves: what does the housing market want and how could we actually deliver it? Then it's time to get creative and figure out how to pivot our collective product. There are, of course, lots of levers we can pull.
Cover photo by Nate Foong on Unsplash


 132
132